Investigative leads that can be traced back
Investigators are rarely short of data. What is hard is finding the pattern inside thousands of records that look unremarkable one at a time. SENTINEL is a desktop tool that reads public crime data, runs the statistics over it and ranks what is worth a closer look — and every result traces back to the exact records, model and settings it came from. If an analyst cannot show why a lead ranked where it did, it should not be a lead.
This is analytical software that ranks locations and associations from public crime data. It is a tool for directing an analyst’s attention, not a system that decides anything about a person.
The calibration and fairness pages exist because a model that is well ranked and badly calibrated is more dangerous than no model. Phase 3–5 planning is explicitly fairness-first, and published benchmarks are a stated deliverable rather than a marketing claim.
What this is, in one minute
A burglary, a theft from a car, an insurance claim. Each one is unremarkable on its own, and what connects them only shows up when somebody lines hundreds of them up and looks. That is slow work by hand, and the analytics contracts that do it at scale are priced out of reach of most forces.
SENTINEL reads the records in and runs established statistical models over them: where crime is dense, which incidents look like one series rather than many, which area a series was most likely run from. It ranks what is worth a closer look. Every stage writes down what it did, so a lead arrives carrying its source records, the model and the settings behind it.
Smaller and regional forces, where the large analytics contracts are out of reach — this runs on one ordinary desktop computer and is built for a single analyst rather than a department. Fraud and repeat-offender investigators, where the pattern sits across incidents nobody filed together. Researchers, who can retrace any result to the records that produced it.
Two of the real models, compiled to WebAssembly
models/KDEHotspot and models/HawkesProcess — the same
C++ an analyst runs on the desktop, compiled with Qt for WebAssembly and fed points you
place yourself. Click the map to add incidents.
KDEHotspot + HawkesProcess — WebAssembly
not loaded2.4 megabytes (MB) because Qt6Core comes with it. That is the honest cost of running the real model rather than a lookalike, and nothing downloads until you ask.
Ingest → Natural Language Processing (NLP) → features → models → inference
Each stage writes what it did into the provenance chain, so a lead at the end carries the record of how it got there.
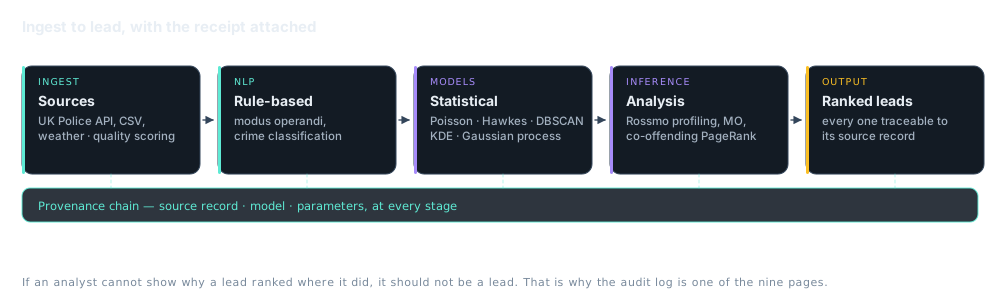
UK Police Application Programming Interface (API) and historical feeds, Comma-Separated Values (CSV) import with auto-detected UK / US-city / generic layouts, weather via Open-Meteo, and data-quality scoring with quarantine thresholds.
Classical, rule-based modus-operandi extraction and crime classification. No language model in the loop — deliberately, because the output has to be explainable.
Poisson counts, Hawkes self-exciting processes, series detection by Density-Based Spatial Clustering of Applications with Noise (DBSCAN), KDE hotspots, Gaussian process regression, Bayesian and ensemble layers.
Rossmo geographic profiling, MO analysis, evidence scoring, anomaly detection, co-offending PageRank and community detection, and the hint engine.
Two models over the same incidents
Place incidents on the map. KDE asks where crime is dense. Rossmo’s formula asks something different and more interesting: given that offenders avoid a buffer zone around home, where does the offender most likely live? Both run live, over the same points you place.
sentinel — spatial inference
Click to add an incident. The surfaces recompute on every point.
Top-ranked lead
Provenance chain
What works today
- End-to-end pipeline from ingest to ranked leads
- 495 automated tests
- Real-data validation on UK and US datasets
- Windows and Linux packaging
- Local read-only Representational State Transfer (REST) API
- Nine-page dashboard: events, map, calibration, cases, co-offending graph, leads, audit log, settings, debug
What does not
- Rule-based NLP only. Modus-operandi extraction is classical, with the recall limits that implies.
- Single-machine desktop. No multi-user deployment, no shared case state across analysts.
- Limited live connectors. Few real-time data sources are wired up.
- Basic map. Custom-rendered, not a Geographic Information System (GIS). Optional GIS integration is a Phase 3–5 item.
Phases 3–5, planned
Multi-jurisdiction support, optional GIS integration, published benchmarks,
fairness-first deployment, and a possible managed service. The backlog is in
REMAINING.md rather than in a roadmap deck.
Finds patterns in crime data, and shows its working
Analysts drown in incident records. This looks for the patterns across them and ranks what is worth a closer look, while keeping a trail back to the evidence behind every suggestion.
Smaller and regional police forces
The large analytics contracts are out of reach on most budgets. This runs on one ordinary desktop computer and is meant for a single analyst rather than a department.
Fraud and repeat-offender investigators
Insurance fraud and organised retail theft look like unrelated incidents until someone lines them up. This does the lining up, and points at where the next one is likely to be.
Researchers studying crime and policing
Every result can be traced back to the exact records and settings that produced it, so another researcher can check the work rather than take it on trust.
Every lead carries its own receipt
Source record, model, parameters, and the transformation at every stage. An audit log viewer is one of the nine dashboard pages, not a feature request. For software that ranks where police attention goes, that is the minimum bar — and it is the reason the research prototype behind it, ARIA-INTEL, is labelled as not ready for the same use.